Another 5.2 million people filed initial jobless claims last week, which puts the four-week total to almost 22 million initial jobless claims. A normal month sees almost a million jobless claims due to typical job churn, so that leaves us with about 21 million above-baseline jobs lost specifically in relation to this COVID-19 economic shutdown.
Continuing jobless claims, which is a more cumulative measure, lags initial claims, and is currently up to 12 million people. This is nearly double the 6.6 million peak reached in 2009, and is still climbing as weekly initial jobless claims continue pouring in.

Chart Source: St. Louis Fed
If we look at total nonfarm payroll numbers in the United States, we had 152 million people classified as employees in early 2020. This is up from 138 million employees that we had at the previous cycle peak in 2007, and up from 129 million employees that we had at the previous cycle bottom in 2010. This chart only gets updated monthly, and with a lag:

Chart Source: St. Louis Fed
If we indeed have over 20 million lost jobs at the moment (and continuing claims will catch up in the weeks ahead), that suggests that we have fewer jobs today than the cycle peak in 2007, and slightly more jobs than we had at the cycle bottom in 2010. We’ll see in the coming months as this chart is updated by the U.S. BLS.
Between economic gravity and policy response
This next chart shows the max price drawdowns year-to-date of exchange-traded funds that closely resemble the three TSP equity funds:
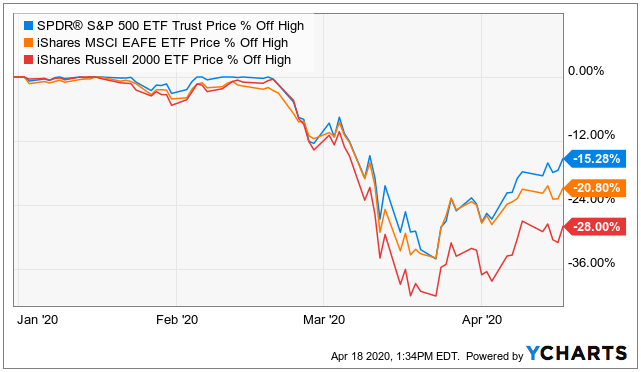
Chart Source: YCharts
The SPDR S&P 500 ETF follows the same index as the C Fund, and the iShares MSCI EAFE ETF follows the same index as the I Fund. These funds fell by about 34% this year from peak to trough. The iShares Russell 2000 ETF follows a different but similar index to the S Fund, and fell by around 42%.
So far, these drawdowns have been in line with how they perform in typical recessions, rather than major recessions or depressions. For example, in the major 2008 financial crisis, all of these funds fell by more than 60% from their highs:
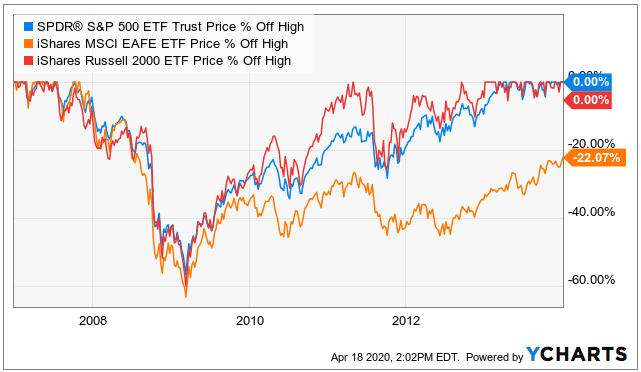
Chart Source: YCharts
It’s still not clear if this was “the bottom” or if stocks will retest the bottom and possibly find new lows later this year. It will depend on many factors.
One of the biggest differences this time is that the federal government, as well as the country’s central bank, responded in far larger magnitude, and far more quickly in this downturn than they did in 2008. The Federal Reserve, for example, injected about $2.2 trillion into financial markets in the past two months:
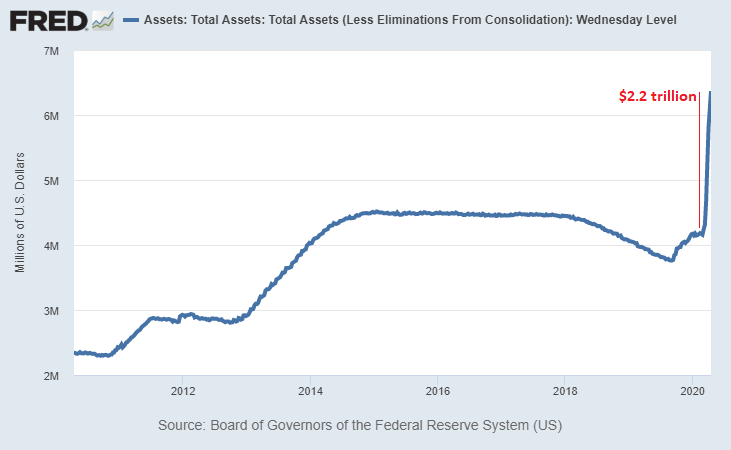
Chart Source: St. Louis Fed
This tug-of-war between economic gravity and the unprecedented amount of fiscal and monetary response we are seeing will persist for a while.
It’s very challenging to price assets in this environment because an analysis is based in part on estimating how much government and central bank assistance will be injected into the economy and financial markets.
TSP Waives Notarization Requirement on Withdrawal Decisions
Lyn Alden is a financial writer and an engineer, and holds a bachelor’s in engineering and a master’s in engineering management, with a focus on financial modeling and resource management. She specializes in analyzing and presenting financial data. Her investment work can be found on LynAlden.com.

