For companies in the TSP C Fund, their debt levels indicate that corporate expansions, dividends, and share repurchases may not grow quite as quickly going forward as they have recently. Consider that corporate debt as a percentage of GDP in the United States is at a record peak of over 45%:
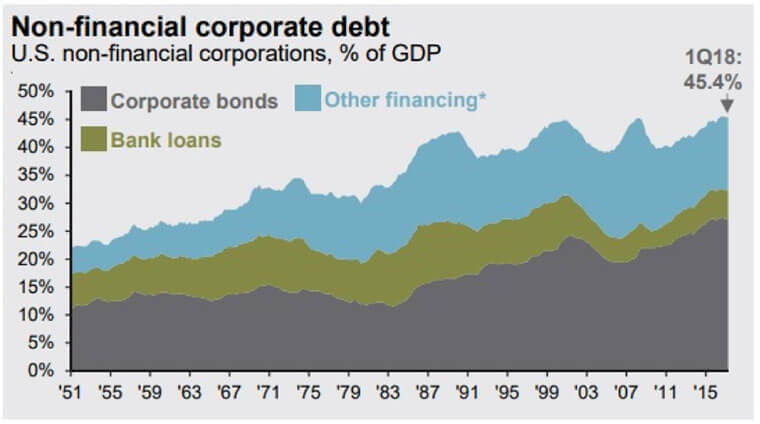
Source: JP Morgan Guide to the Markets, 3Q 2018
This figure excludes banking leverage, and just focuses on non-financial corporations like Microsoft and Nike. Much of this debt is held by large companies in the TSP C Fund.
Over the last few decades, non-financial (i.e. not banks) corporate debt levels have tended to move between the upper-30’s and the mid-40’s as a percentage of GDP, depending on where we are in the business cycle. And right now, we’re on the high side of that historical range, which has generally been associated with being late in the business cycle.
The good news is that in an absolute sense, corporate debt in the United States is not dangerously high. China currently has a corporate debt bubble, with corporate debt more than twice as a high as a percentage of GDP than the United States, according to the Bank for International Settlements. France, Canada, Japan, and many other developed nations have corporate debt that is higher than the U.S. as well.
Another way to measure corporate debt levels is to use the interest coverage ratio. This ratio checks how many times larger a company’s income is compared to its current debt interest expense, and here’s the chart:
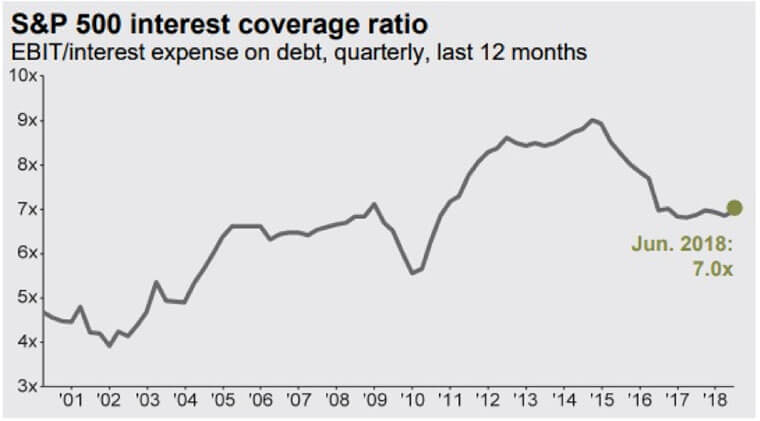
Source: JP Morgan Guide to the Markets, 3Q 2018
Currently, the interest coverage ratio of the S&P 500 (and thus the C Fund that tracks it) is 7x, which means that 1/7th of corporate income is used to pay for interest on their debt.
A few years ago in 2014, before the big decline in oil prices that hurt the energy sector, C Fund companies were only paying 1/9th of their income towards debt interest thanks to very low interest rates.
As the Federal Reserve has gradually raised interest rates over the last 2-3 years, and as some companies have issued extra debt to perform more share repurchases, and as the energy sector has taken on debt to survive a period of low oil prices, companies on average are now paying this larger share of income towards debt interest.
The usual trend is that as we get later in the business cycle, corporate debt levels and interest coverage ratios both tend to inch upward. When a recession hits, corporate income falls, and so their interest coverage ratios hit a low point because they still have to pay interest on their debts despite having less income to do so. But then, the Federal Reserve usually reduces interest rates during a recession, and companies focus on balance sheet stabilization and debt payoff, and companies emerge from a recession with less debt. As corporate earnings strengthen post-recession, their interest coverage ratios start to rise once more, and they begin confidently taking on more debt to fund growth, dividends, and share repurchases once again.
For now, what the debt ratios show is that corporations in the C Fund have already used most of their available leverage by historical standards, and therefore corporate expansions, dividends, and share repurchases may not grow quite as quickly going forward as they recently have.
Lyn Alden is a financial writer and an engineer, and holds a bachelor’s in engineering and a master’s in engineering management, with a focus on financial modeling and resource management. She specializes in analyzing and presenting financial data. Her investment work can be found on LynAlden.com.

